
Supporting Data
ENVIRONMENT
Data presented here support the Environment section of this report. Data from ERM’s acquisition of JSC is excluded.
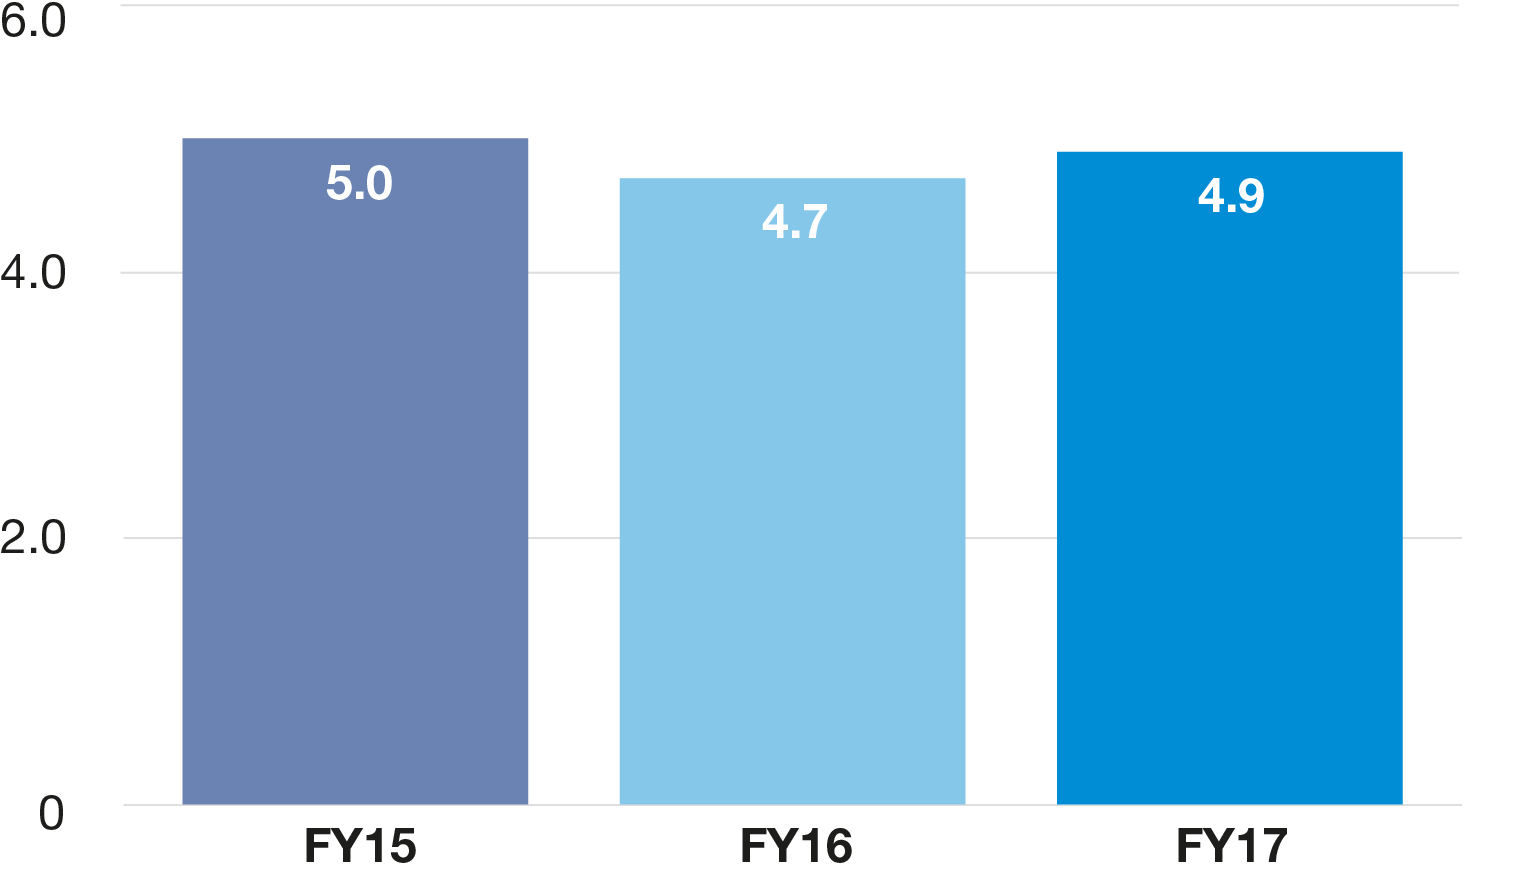
GHG emissions intensity
GHG emissions intensity FY15 - FY17 (tCO2e/FTE)
-
Notes:
Total greenhouse gas (GHG) emissions normalized by average full-time equivalent (FTE) employees.FY16 GHG emissions data (used to calculate emissions intensity) reported in the FY16 Sustainability Report was overstated by 5.1% (1,110 tCO2e). This was due to data errors in the calculation methods and incorrect data entries in the North America business. FY16 data presented in this report has been restated to correct for these errors.
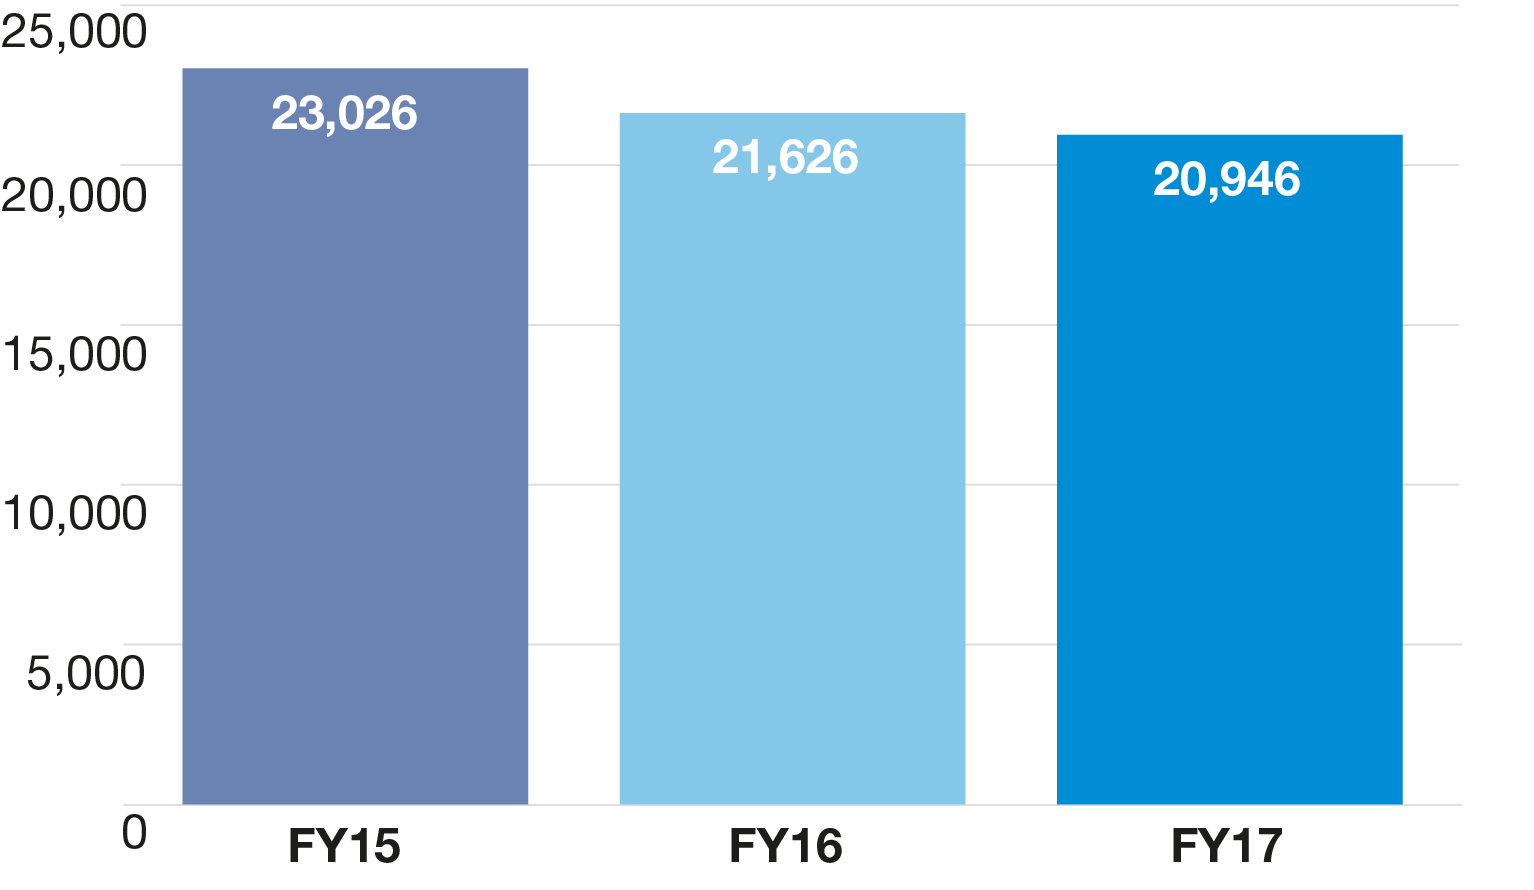
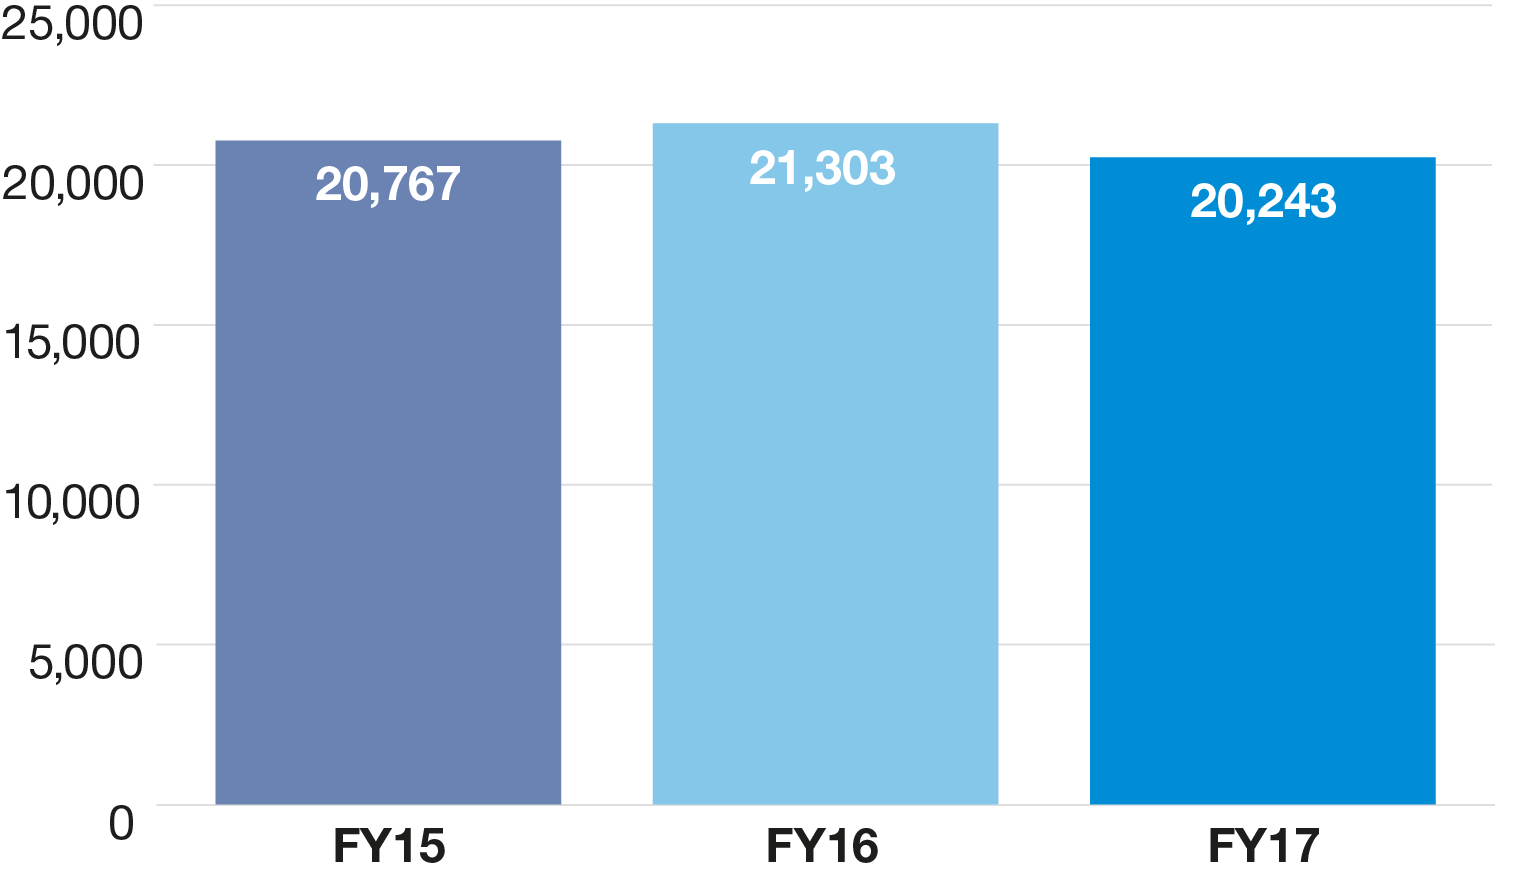
Total GHG emissions
Total GHG emissions FY15 - FY17 (tCO2e)
Total GHG emissions by region FY15 - FY17 (tCO2e)
| Total GHG | |||
|---|---|---|---|
| FY15 | FY16 | FY17 | |
| Europe, Middle East and Africa | 4,899 | 4,243 | 4,439 |
| Asia Pacific | 4,972 | 4,365 | 3,869 |
| Latin America and Caribbean | 1,448 | 1,032 | 910 |
| North America | 10,552 | 10,379 | 10,393 |
| Global Businesses | 597 | 945 | 565 |
| Group | 558 | 663 | 771 |
| Total | 23,026 | 21,626 | 20,946 |
Notes
Total GHG emissions include Scope 1, 2 and 3 emissions.
Data has been calculated using a market-based approach, unless otherwise stated. For further information on market-based methods, please refer to http://www.ghgprotocol.org.
The FY16 data for total GHG emissions reported in the FY16 Sustainability Report was overstated by 5.1% (1,110 tCO2e).This was due to data errors in the calculation methods and incorrect data entries in the North America business. FY16 data presented in this report has been restated to correct for these errors.
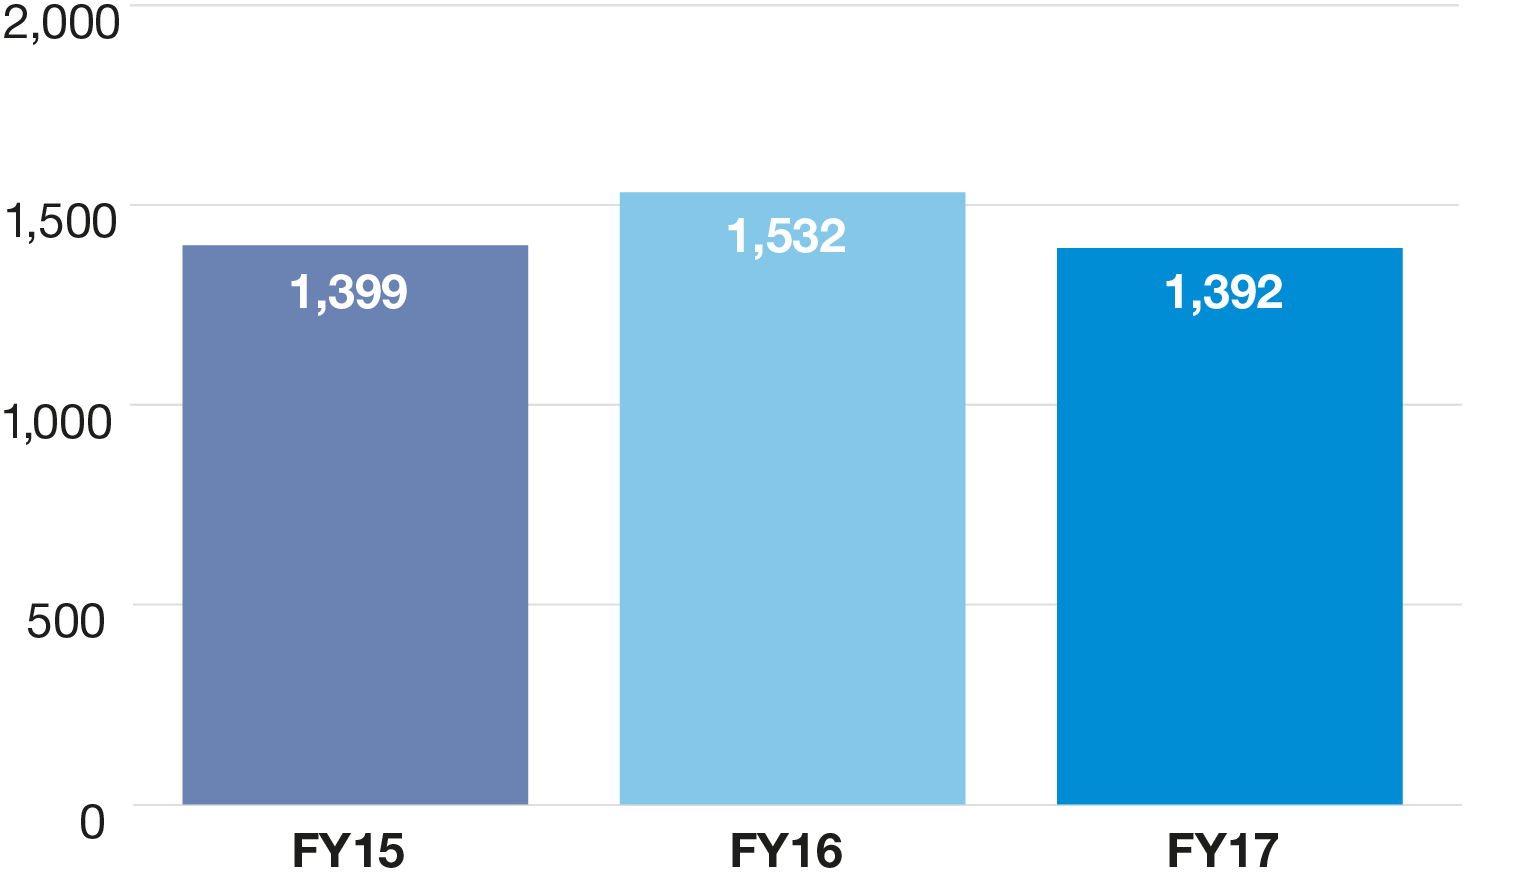
GHG scope 1 emissions
Scope 1 emissions FY15 - FY17 (tCO2e)
| Location | FY15 | FY16 | FY17 |
|---|---|---|---|
| Europe, Middle East and Africa | 473 | 423 | 545 |
| Asia Pacific | 104 | 80 | 105 |
| Latin America and Caribbean | 71 | 56 | 40 |
| North America | 752 | 972 | 701 |
| Global Businesses | 0 | 1 | 1 |
| Total | 1,399 | 1,532 | 1,392 |
Notes
Scope 1 includes direct emissions from operations we own or control.
Scope 1 is expressed as CO2e and includes all Kyoto gases and refrigerants.
Scope 1 emissions from Global Businesses and Group are included in the data for the ERM region in which employees home offices are located.
FY16 Scope 1 GHG emissions data reported in the FY16 Sustainability Report was overstated by 0.4% (4 tCO2e). This was due to errors in the calculation methods and incorrect data entries in the North America business. FY16 data presented in this report has been restated to correct for these errors.
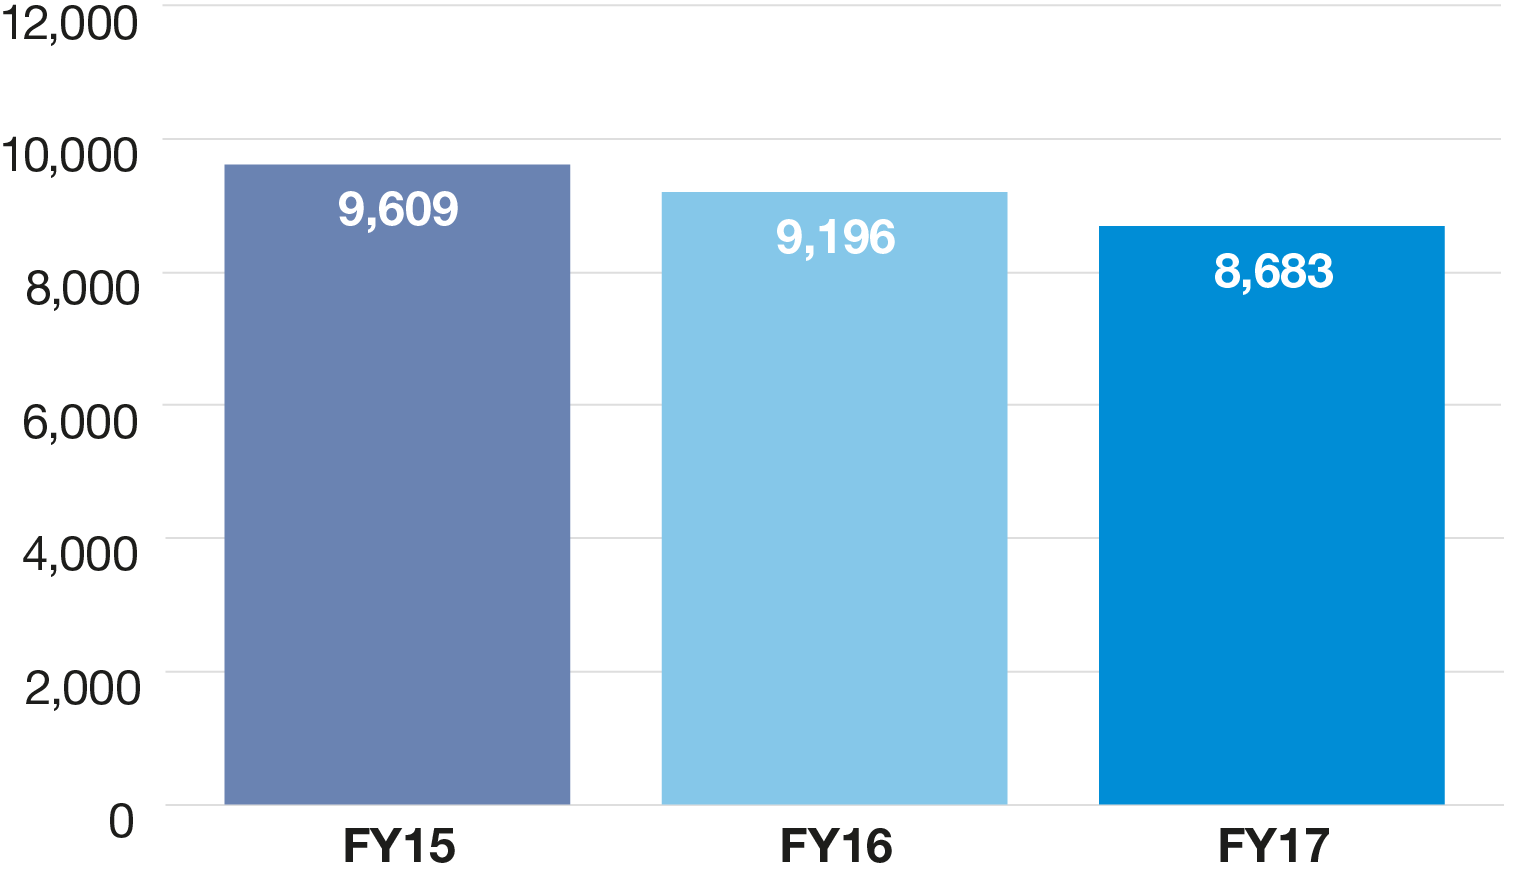
GHG scope 2 emissions
Scope 2 emissions FY15 - FY17 (tCO2e)
| Location based | Market based | |||||
|---|---|---|---|---|---|---|
| FY15 | FY16 | FY17 | FY15 | FY16 | FY17 | |
| Europe, Middle East and Africa | 1,729 | 1,360 | 1,284 | 1,901 | 1,486 | 1,480 |
| Asia Pacific | 2,602 | 2,547 | 2,173 | 2,550 | 2,501 | 2,142 |
| Latin America and Caribbean | 287 | 290 | 254 | 287 | 290 | 254 |
| North America | 4,945 | 4,915 | 4,878 | 4,870 | 4,882 | 4,808 |
| Global Businesses | 0 | 1 | 0 | 0 | 37 | 0 |
| Total | 9,563 | 9,113 | 8,589 | 9,609 | 9,196 | 8,683 |
Notes
Scope 2 includes indirect emissions from the generation of purchased electricity, heating, cooling and steam that we consume or use.
Scope 2 is expressed as CO2e and includes all Kyoto gases.
Scope 2 emissions from Specialty Global Businesses and Group are included in the data for the ERM region in which employees home offices are located. However from FY16, due to an office opening, there are Scope 1 emissions for Specialty Global Businesses.
For further information on Scope 2 location and market-based methods, please refer to http://www.ghgprotocol.org.
FY16 Scope 2 data reported in the FY16 Sustainability Report was overstated by 3.3% (317 tCO2e). This was due to data entry errors in the North America business. FY16 data presented in this report has been restated to correct for these errors.
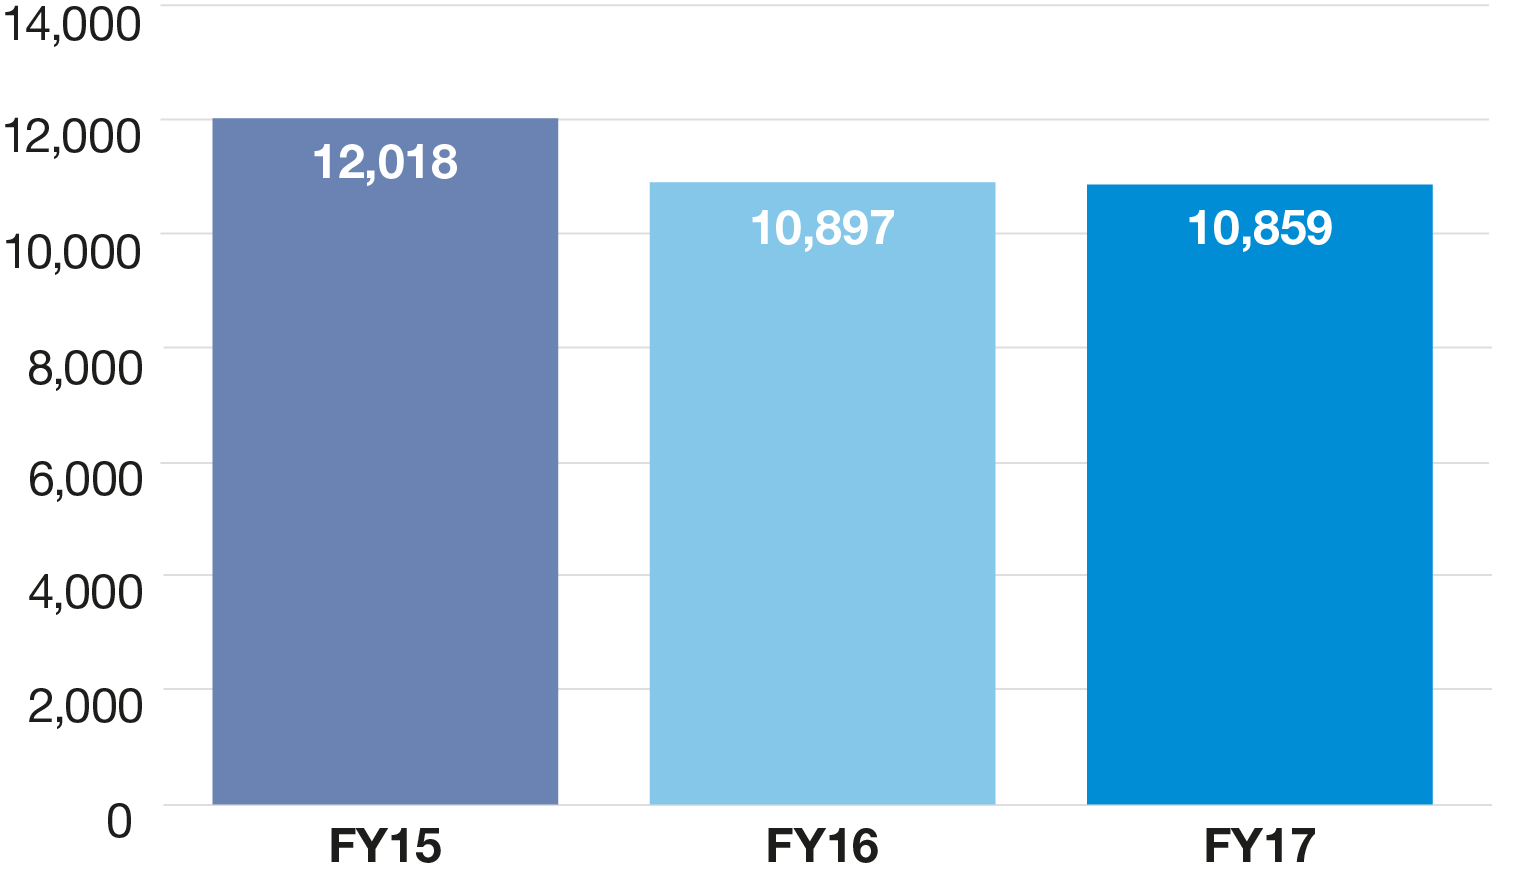
GHG scope 3 emissions
Scope 3 emissions FY15 - FY17 (tCO2e)
| FY15 | FY16 | FY17 | |
|---|---|---|---|
| Europe, Middle East and Africa | 2,525 | 2,332 | 2,414 |
| Asia Pacific | 2,318 | 1,783 | 1,622 |
| Latin America and Caribbean | 1,090 | 686 | 616 |
| North America | 4,930 | 4,525 | 4,884 |
| Global Businesses | 597 | 907 | 552 |
| Group | 558 | 663 | 771 |
| Total | 12,018 | 10,897 | 10,859 |
Notes
Scope 3 includes other indirect emissions that occur outside ERM (e.g., business travel).
Scope 3 is expressed as CO2e and includes all Kyoto gases and refrigerants.
FY16 Scope 3 GHG data reported in the FY16 Sustainability Report was overstated by 6.8% (789 tCO2e). This was due to data calculation errors in the North America business. FY16 data presented in this report has been restated to correct for these errors.
Global office energy use
Global office energy use FY15 - FY17 (MWh)
Notes
Employees from Global Businesses and Group are included in the data for the ERM region in which their home offices are located.
The portion of shared resources for which ERM is responsible in multiple-occupant buildings, where this amount is not already reported or included in office billings.
RECs are Renewable Energy Certificates, i.e., the tradable part of generated electricity from renewable resources representing attributes such as GHG emissions.
FY16 office energy use data reported in the FY16 Sustainability Report was overstated by 5.0% (1113 MWh). This was due to data entry errors in the North America business. FY16 data presented in this report has been restated to correct for these errors.
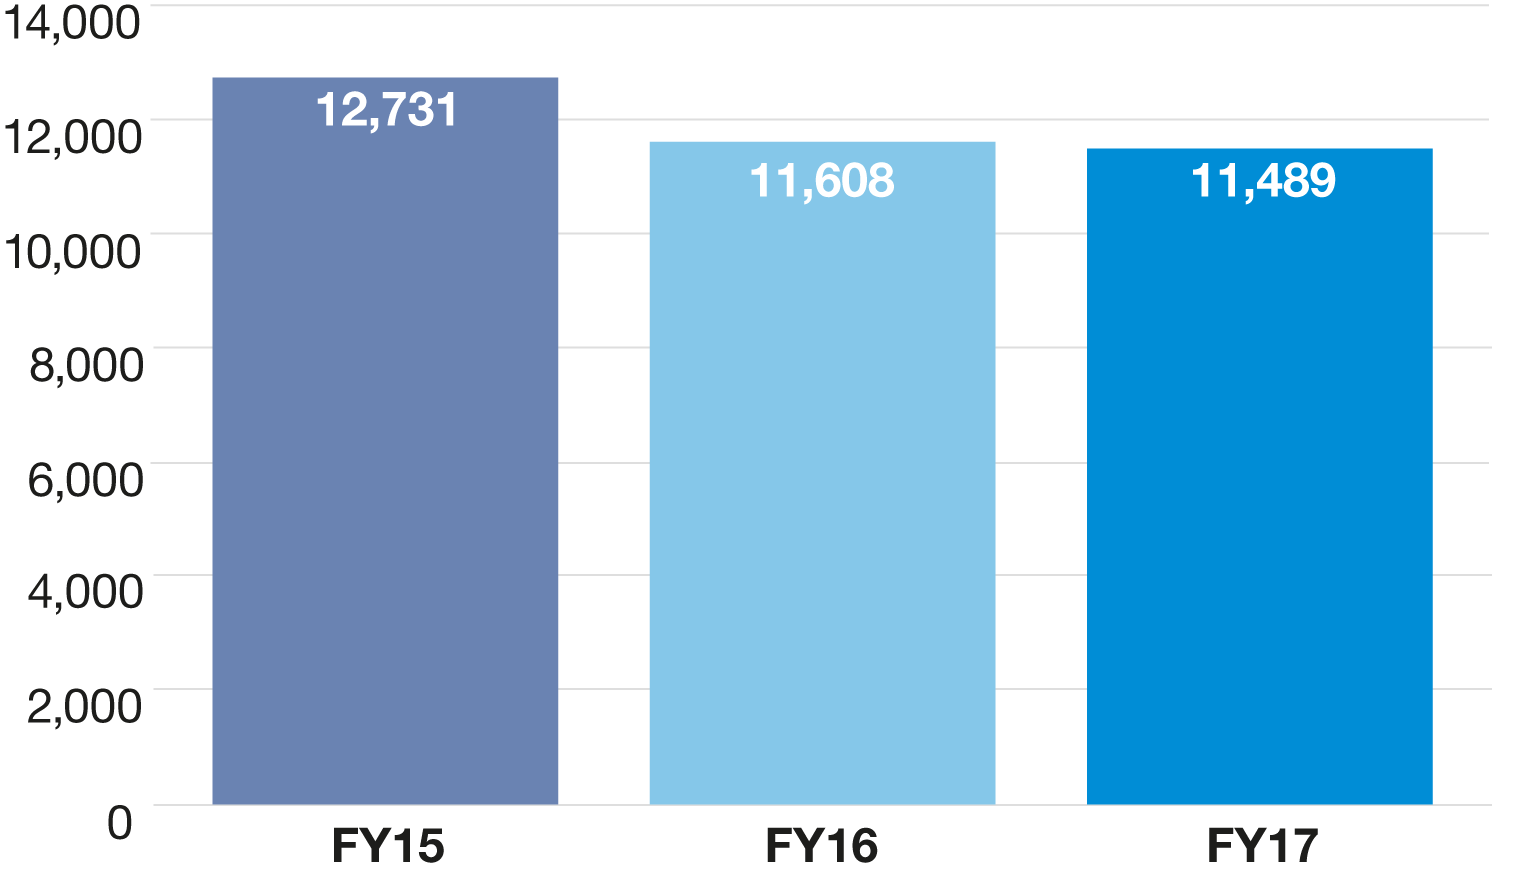
Business travel
Business travel FY15-FY17 (tCO2e)
Business travel FY15-FY17 (tCO2e)
| FY15 | FY16 | FY17 | |
|---|---|---|---|
| Europe, Middle East and Africa | 2,777 | 2,572 | 2,670 |
| Asia Pacific | 2,340 | 1,795 | 1,632 |
| Latin America and Caribbean | 1,135 | 719 | 635 |
| North America | 5,324 | 4,951 | 5229 |
| Global Businesses | 597 | 907 | 552 |
| Group | 558 | 663 | 771 |
| Total | 12,731 | 11,608 | 11,489 |
Notes:
Business travel emissions total includes all Scope 3 emissions (10,859 tCO2e) plus Scope 1 emissions associated with fuel consumption for leased vehicles (630 tCO2e).
Data is expressed as CO2e and includes all Kyoto gases.
FY16 Business travel data reported in the FY16 Sustainability Report was overstated by 6.4% (789 tCO2). This was due to data entry errors in the North America business. FY16 data presented in this report has been restated to correct for these errors.
Business travel by mode FY15 - FY17 (tCO2e)
| FY15 | FY16 | FY17 | |
|---|---|---|---|
| Air | 9,368 | 8,201 | 7,970 |
| Road |
3,191 | 3,266 | 3,347 |
| Rail | 172 | 141 | 172 |
| Total | 12,731 | 11,608 | 11,489 |
Notes:
Includes Scope 1 and 3 car travel.
FY16 Business Travel data reported in the FY16 Sustainability Report was overstated by 6.4%. This was due to data entry errors in the North America Business. FY16 data presented in this report has been restated to correct for these errors.
US hazardous and nonhazardous waste
US hazardous and nonhazardous waste FY17 (metric tons)
| FY17 | ||
|---|---|---|
| Hazardous waste | Nonhazardous waste | |
| Recycled | 0.00 | 22.25 |
| Disposal | 0.04 | 32.12 |
| Total | 0.04 | 54.37 |
Notes:
ERM has been requested to provide waste data in the United States, to meet the procurement requirements of a large industry sector.
References
| Gas | Type | Reference |
|---|---|---|
| CO2 | Air travel: long-haul, short-haul, domestic | 2016 UK Government GHG Conversion Factors v1.0, published June 2016 |
| CO2 | Rail travel | 2016 UK Government GHG Conversion Factors v1.0, published June 2016 |
| CO2 | Vehicle (road) travel: all fuel types | 2016 UK Government GHG Conversion Factors v1.0, published June 2016 |
| CO2 | Electricity: International | IEA CO2 Emissions from Fuel Combustion (2016 Edition), CO2 emissions factors for Electricity Generation per kWh |
| CO2 | Electricity: US | US Environmental Protection Agency, eGRID2014. |
| CO2 | Electricity: UK | 2016 UK Government GHG Conversion Factors v1.0, published June 2016 |
| CO2 | Electricity: Europe (Market based) | Reliable Disclosure System for Europe (2014) |
| CO2 | Fuel: heating | IPCC 2006 Guidelines for National Greenhouse Gas Inventories |
| HFCs/F‑Gas | Refrigerants |